Wednesday, 7 July 2010

Part 2 of 3 - Creating a Pivot Collection


This series of articles cover the process from concept to release of how RoomSeeker.eu integrated visual search using Pivot Viewer for Silverlight:

This is part 1 of a 3 part series:

Part 1 – What is Pivot

Part 2 – Creating a Pivot Collection (this article)

Part 3 – Creating a custom Silverlight Pivot View application

Creating a Pivot View Collection

For a deep dive on general collection design check out the article on silverlght.net, in this post we look at the steps required to create a pivot collection.

  1. Create composite images for input to deep zoom
  2. Create deep zoom data
  3. Create Pivot meta data

Step 1 - Create composite images

To keep things simple, pivot view only displays static images, so any text overlays, borders etc need to be burnt into an image.

Key things to consider are aspect ratio, size, borders, and image quality along with the information you want to overlay. For RoomSeeker.eu we decide on the following info:

  • Hotel Name, Town, County (State), Star rating, Star accreditor
  • Hotel Photo
  • Room Price from
  • Location

A sample composite image taken from the site is shown below containing the text overlays and location information on a map.

clip_image002

So knowing what we want, how do we go about creating these 7000 images? Options include:

  1. Manual via Paint
  2. 3rd party tool such as Photoshop which allows for a data merge functionality
  3. Create a custom app

Option 1 is clearly a non-starter, but depending on your in house skills options 2 and 3 are the way to go.

For us a custom app seemed the most flexible, as it could pull data direct from the database and integrate future changes via our content management system. So the only question now is what sort of app, options considered were:

  1. Create images via .NET bitmap APIs
  2. Create images via embedded IE web control
  3. Create images via XAML using WPF app

For simple image templates option 1 would be the simplest solution, but we wanted to have the image driven via a content template which pushed us into the direction of either being HTML based or XAML based. In the end we went for XAML as we could then create the templates in Expression Blend and incorporate smart controls such as our hotel map.

So we ended up with a WPF app that pulled the data from the database and then created a custom Bitmap for each hotel based on a XAML template and inject the hotel data. Once we had our custom XAML this was then loaded into a canvas object using the code below:

   1: Canvas oCanvas = (Canvas) XamlReader.Parse(
   2:                 InjectData(xamlTemplate,hotel));
   3: int  iWidth  =  (int)oCanvas.Width;
   4: int  iHeight  =  (int)oCanvas.Height;
   5:  
   6: oCanvas.Arrange(new  Rect(0,  0,  iWidth,  iHeight));
   7:  
   8: RenderTargetBitmap  oRenderTargetBitmap  =  new  RenderTargetBitmap(iWidth,  iHeight,  96,  96, PixelFormats.Default);
   9:      
  10: oRenderTargetBitmap.Render(oCanvas);
  11:  
  12: // Save image using JpegBitmapEncoder 

Xaml to Bitmap code

So the end result is a direct with 7,000 custom images which can now be used to create the deep zoom collections.

Step 2 - Create deep zoom data

Creating the deep zoom data is the easiest part of this project thanks to the DeepZoom.dll library. A deep zoom collection consists of image tiles and collection meta data.

Using the .NET4 parallel extension the following code will kick off 4 threads to create the deep zoom imagery via the DeepZoom API ImageCreator

   1: Parallel.ForEach(titles, new ParallelOptions { MaxDegreeOfParallelism = 4 }, (title) =>
   2:      {
   3:       new ImageCreator{ MaxLevel = 9 }.Create( imagePath, 
   4:     string.Format(@"{0}\{1}.xml", outputDirectory, title.Id));  
   5:      });
   6:  
   7: Once the images have been produced we then create the meta data, via the CollectionCreator API:
   8:  
   9:   new CollectionCreator().Create(titles.Select(t => string.Format(@"{0}\{1}.xml", outputDirectory, t.Id)).ToList(), string.Format(@"{0}\collection.dzc", outputDirectory));

Thanks to blog.smartx.com for this code, used as part of his NetFlix browsing article.

And that’s pretty much it, though using the DeepZoom.dll I couldn’t figure out how to set a minimium zoom level as the tool wanted to create 9 zoom levels, of which levels 0 to 4 are very small and <1k in size, ( need a MinLevel = 3 option)?

Note: Word of warning my 7,000 files (400MB) now went up to 100,000 files (575MB size / 842MB size on disk) and 78,000 folders.

Step 3 of 3 - Create Pivot metadata

In the previous steps we created the deep zoom data, now we need to create Pivot metadata to inform the viewer:

  • How we allow the user to filter or search the information via the filter panel e.g. Number of rooms, Location, price.
  • How we group the results via the sort drop down, e.g. by city, user ratings.
  • What information is displayed in the information panel for a given image e.g. hotel description, contact details etc.
  • Collection Name provides the ability to give the collection a name and (in Silverlight) a custom logo.

clip_image006

For a deep dive on the Pivot meta data see the Collection XML Schema article on Silverlight.net.

Filter panel For us this is still a work in progress, we’ve got the basics such as price, ratings, location, but are still iterating with attention to group of data e.g. hotel features / room features.

Sort Dropdown Care should be taken to not overload the user with irrelevant sort groups, e.g. is group by hotel name really useful? At present we’ve got most of the filter panel appearing in the sort dropdown, but may remove some after testing / user feedback.

Item panel I need to investigate this further, but currently my item panel will only display a button to link to an external URL via the Pivot app, but for the Silverlight control we have to option to multiple buttons and custom event handlers, e.g. to display a Silverlight dialog box. Note: For this release of the Silverlight control you cannot change the size / color of the buttons.

Info Panel Displays data related to the hotel, including extended information pulled from a secondary.cxml data file that holds the hotel descriptions which can be quite large.

The key part of the design here is to decide what information is important to your users. You may want to group things to help the user find the correct info, for example our database has a list of hotel features, but for this panel we broke down the features into groups for hotel and room features to keep the options brief as the panels are quite narrow so text needs to be concise.

Issues:

  • To reduce the size of downloads I split the collection into 7 collections of ~1000 hotels each. This has the negative effect of searches in the filter panel being restricted to items in the current collection, e.g. if the user is viewing hotels in the South East of England they won’t see any search results for the South West unless they switch collections.
  • Do you want your collection to be consumed by both your Silverlight control, other Silverlight apps, WFP Pivot App? If so then you may want to ensure core functionality does not rely on logic built into your custom Silverlight Pivot Viewer app.
  • The secondary file can be quite large, would be good if that was split into multiple files, not sure if this is possible or not?
  • In the future I may also support dynamic collections e.g. based on search / availability.


This is part 2 of a 3 part series:

Part 1 – What is Pivot

Part 2 – Creating a Pivot Collection (this article)

Part 3 – Creating a custom Silverlight Pivot View application

Tuesday, 6 July 2010

Part 1 of 3 - How RoomSeeker.eu integrated visual search using Pivot Viewer for Silverlight


In this series of 3 posts we will cover the process of adding visual search to RoomSeeker.eu integrated visual search using Pivot Viewer for Silverlight:

Part 1 – What is Pivot (this article)

Part 2 – Creating a Pivot Collection

Part 3 – Creating a custom Silverlight Pivot View application


RoomSeeker.eu provides details on late room availability for hotel rooms across Europe. The site is built on MVC 2.0 using ASP.NET 4.0 and supported by Microsoft BizSpark Programme. Currently the site integrates mapping and text search for users to find hotels.

As it stands the site is similar to a lot of other hotel sites, so we were looking for something to help us stand out from the crowd, so decided to integrate a Pivot collection based on the Silverlight Pivot Viewer Control into our site in the form of a visual search page, as shown below or you can try it out here.

clip_image002

RoomSeeker.eu Visual Search page

Even though the app is quite basic and probably needs a few more iterations, it’s already provided useful for queries such as:

  • “Show me all the AA rated hotels that take pets and cost less than £150 in the South East of England”
  • “Show me all beach hotels group by town in Suffolk”


Part  1 of 3 Introduction to Pivot

Quoting Microsoft “Pivot makes it easier to interact with massive amounts of data in ways that are powerful, informative, and fun.” The data in this case is a mixture of images and metadata associated with the image. This metadata could include:

  • How we allow the user to filter or search the information via the filter panel e.g. Number of rooms, Location, price.
  • How we group the results via the sort drop down, e.g. by city, user ratings.
  • What information is displayed in the information panel for a given image e.g. hotel description, contact details etc.
  • Collection Name provides the ability to give the collection a name and (in Silverlight) a custom logo.

clip_image002[4]

Once we’ve created a collection we can then view the collection via a Pivot Viewer, currently Microsoft offers two viewers:

WPF Client (via getpivot.com ) This only works on Windows 7 or Vista, requires .NET 3.5 SP1 and IE8, but once installed you can browse many public pivot collections including our e.g. for rooms in the east of England past the following into the navigation bar http://roomseeker.eu/content/pivot/v2/e/collection.cxml

Pivot Viewer for Silverlight Control – Developers can use this control to embed Pivot collections into their Silverlight applications / websites on both Windows and Mac devices.

Note: As a Pivot Collection is just a few XML files mapping to deep zoom collection I wouldn’t be surprised to see clients for other devices (we already have the excellent Seadragon, a deep zoom client, on the iPhone) and perhaps a HTML 5 client making use of the hardware acceleration of IE9?


This is part 1 of a 3 part series:

Part 1 – What is Pivot (this article)

Part 2 – Creating a Pivot Collection

Part 3 – Creating a custom Silverlight Pivot View application

Friday, 19 February 2010

Windows Phone 7 Series Countdown to Mix 10


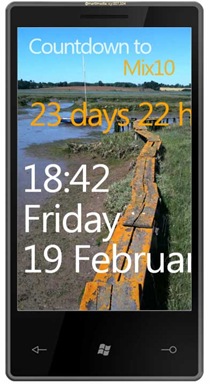
mixcountdownWith the launch of Windows Phone 7 Series this week I’ve created a simple Silverlight project to simulate the phones clock screen and added a countdown timer for Mix 10.

The key items in the project were:

1. Assume WVGA model ( 480 x 800 pixels)

2. Add a view box to enable scaling of the window

3. Add a KerningTextBlock control to get text closer to Windows phone, thanks to Danteq for this code, by enabling a text kerning in Silverlight 3, though I had to change  from Padding to Margin to support negative trackingproperty.

4. Use of the windows font Segoe UI 

To see demo click here

The code can be downloaded at: http://www.martimedia.com/public/beta/ClientBin/mmMobile7.zip

Tuesday, 10 November 2009

New pricing plan for Silverlight Bing Maps

Great news today, as Microsoft has announced new Terms of Service for Bing Maps and released version 1.0 of the Silverlight control for Bing Maps.

Due to the power of Silverlight to serve up large amounts of tiles to the end user the old commercial model would made it commercial suicide for a small developer (see previous post) to use Bing Maps, as a user session could consume a huge number of tiles resulting in CPM rates in the region $100/CPM.

Well now it’s all change with a session based pricing model, with free access for education/non-profit and free 120K sessions a year for developers.

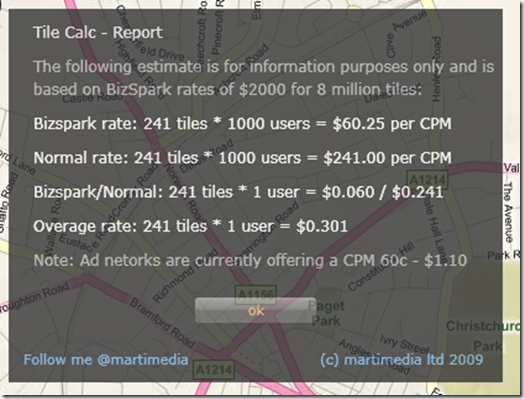
To see how much you save check out my TileCalc demo (based on CTP Silverlight Control and old pricing model).

image

Monday, 18 May 2009

Is Virtual Earth for Silverlight commercial suicide?

Update: Today (10 Nov 2009) Microsoft anounced a change to the Bing Maps Terms of Service which means it's now charged per session rather than tile count, also developers get 125,000 sessions per year for FREE.

Before I start I must state that the Virtual Earth CTP control for Silverlight is a CTP and terms have yet to be announced for commercial use of the control….

Recently I’ve created a couple of visualisations using Virtual Earth CTP control for Silverlight ( see previous entry British Politician’s Expenses ). I’ve been impressed at how easy it is to create web apps with the control. Like most CTPs the commercial model has not been announced for Virtual Earth, but looking at the existing commercial licence fees for Virtual Earth I got a bit alarmed after reading GIS in XML blog entry.

Standard version license is $8000 for 1,000,000/year transactions = 8,000,000/year tile renders. Note: no routing in standard

Advanced version license is $15,000 for 1,500,000/year transactions = 12,000,000/year tiles. Includes routing capability"

"An overage rate (generally $0.01 per transaction) is listed for exceeding the preset number of transactions for use during the term."

The situation is slightly better for Bizspark users costing $2000 for 8,000,000 tiles, though not sure what rate it goes to once 8million rate is exceeded ( $0.01 per 8 tiles seems very high).

To get an understanding of the types of apps I could create using Virtual Earth I needed to know how many tiles a typical user would request on a visit to my site, so I created a simple application which you can try out here.

image

The results are quite alarming, from just going on a simple tour of the world (browser size: 1200x800) London->New York->Sydney->Ipswich I rack up 241 tiles, as a BizSpark customer that would cost me $0.06 or $60.25 per CPM, but even more alarming the overage rate would cost me $0.30 for a single user. If I were to makes use of the mouse wheel to zoom in/out and pan around a few tows I hit 1300 tiles in less than a minute! Clearly running this control on an add funded site is commercial suicide where CPM rates are $0.60 to $1.

image

I know their has been talk of a revised VE commercial licence, as without one this control will remain a niche product. One suggestion I would make would be for the VE team to host Open Street Map data on their servers and offer it free to BizSpak customers, this would be a great way to kick of creativity using MS technology?

As for the app, it makes use of a custom tile server ,shown below, to keep track of the number of tiles consumed. The requests are tracked via a dictionary to ensure we only count unique requests. Once we have a request an event is fired back to the main page and the stats updated to the user.

public class FeedEventArgs : EventArgs

{

public string Msg { get; set; }

public long count { get; set; }

}

public class CounterMapTileSource : Microsoft.VirtualEarth.MapControl.TileSource

{

Dictionary<string, long> d = new Dictionary<string, long>();

long tileCount = 0;

public CounterMapTileSource() : base("http://tile.openstreetmap.org/{2}/{0}/{1}.png") { }

public override Uri GetUri(int x, int y, int zoomLevel)

{

string uri = String.Format(this.UriFormat, x, y, zoomLevel);

string info = String.Format("{0:000#} Zoom x,y: {1:0#} {2} , {3} ", tileCount , x,y,zoomLevel);

if (d.ContainsKey(uri) == false)

{

d.Add(uri, tileCount);

tileCount++;

OnFeedRetrieved(new FeedEventArgs { count = tileCount, Msg = info });

}

return null;

}

public void Reset() { tileCount = 0; d.Clear(); }

public event EventHandler<FeedEventArgs> FeedRetrieved;

protected void OnFeedRetrieved(FeedEventArgs args)

{ if (FeedRetrieved != null)FeedRetrieved(this, args); }

}

Finally a couple of caveats:

If you switch map views then make sure to hit the reset button to clear the custom tile source tile cache, otherwise it may underestimate your usage.

Animation is turned off, as the tile requests for the custom tile map are a lot higher than those for Virtual Earth ( looking at my browser cache and watching Fiddler network traffic.

Thursday, 23 April 2009

British MP’s Expenses Data Visualisation via Virtual Earth CTP


Following on from my previous blog on US Politicians data visualisation using a listbox, this time I’ve moved across the pond to my homeland and created one for British Politician’s Expenses (a bit of a hot topic in the UK at present) based on the CTP of the Virtual Earth for Silverlight control.

The application enables you to quickly view Members of Parliament (MP) expenses for 2007/08 based on:

  • Location / Political Party (colour of the pin)
  • Travel expenses (opacity of the pin)
  • Second home allowance (size of the pin)

Note: An MP represents ~100k people, so map gives a good indication of population density across Britain.

Using the Search tool you can filter the results  based on MP’s name/constituency Travel expenses and second home allowance. Any changes to the map are reflected in the pages URL making it easy to share custom reports via the share button on Twitter, Digg, Facebook and Email.

E.g. the link blow shows MPs in the South East of England:

http://home.btconnect.com/martibiz/mps.htm#?s=&t=0&h=0&y=51.5417&x=-0.1491&z=12

Sample screen shot 

Tech notes:

The visualisation makes use of Client Technical Preview (CTP). The data is sourced from the Guardian MP expense claims with MP geo data coming from TheyWorkForYou, though some data cleansing was required to link the two sets of data. The data is pulled in as  JSON, to keep things as fast as possible I embedded the JSON in the XAP assembly and loaded it using the following code:

void LoadMPdetails()
   {
       Stream file = Assembly.GetExecutingAssembly().GetManifestResourceStream("mmMPs.Assets.mpDetails.js"); 
       TextReader tr = new StreamReader(file);

       JsonArray jsonArray = (JsonArray)JsonArray.Load(tr);

       mps = new List<MP>();

       foreach (JsonObject jsonItem in jsonArray)
       {
           MP item = new MP();
           item.name = jsonItem["name"];
           item.constituency =  jsonItem["constituency"];
           item.party =  jsonItem["party"];
           mps.Add(item);
       }
   }

Even though this is a Silverlight 2.0 application we support deep linking (added to Silverlight 3.0 beta) so you can create custom views and share the links with your friends. Each time the viewport is changed or a search preformed the pages URL is updated and added to the browsers page history using  JQuery and jquery.history and some C# code provided by nerdplusart.com

The code below shows the logic to display the push pin with the tooltips:

private void AddPin2(Loc con)
        {
            // pushpin image
            Image image = new Image();

            if (con.mp == null)
                image.Source = new BitmapImage(new Uri("/assets/pinMagenta.png", UriKind.Relative));
            else        
            switch (con.mp.party)
            {
                case "Liberal Democrat":
                    image.Source = new BitmapImage(new Uri("/assets/pinYellow.png", UriKind.Relative));
                    break;

                case "Conservative":
                    image.Source = new BitmapImage(new Uri("/assets/pinBlue.png", UriKind.Relative));
                    break;
  
                case "Labour":
                    image.Source = new BitmapImage(new Uri("/assets/pinRed.png", UriKind.Relative));
                    break;

                default:
                    image.Source = new BitmapImage(new Uri("/assets/pinMagenta.png", UriKind.Relative));
                    break;
            }

            int size = 35;
            if (con.expense.Cost_Of_Staying_Away_From_Main_Home > 5000)
                size = (int) Math.Min(( (con.expense.Cost_Of_Staying_Away_From_Main_Home - 5000) / 5000) * 10 + 35,80);
            image.Width = size; image.Height = size;

            if (con.expense.Cost_Of_Staying_Away_From_Main_Home < 500)
                image.Opacity = 0.6;
            else
                image.Opacity = 0.6 + (con.expense.Cost_Of_Staying_Away_From_Main_Home / 23000);
            

            image.MouseEnter += new System.Windows.Input.MouseEventHandler(i_MouseEnter);
            image.MouseLeave += new System.Windows.Input.MouseEventHandler(i_MouseLeave);
            image.MouseLeftButtonDown +=new System.Windows.Input.MouseButtonEventHandler(image_MouseLeftButtonDown); // += new System.Windows.Input.MouseButtonEventHandler(image_MouseLeftButtonUp);


            // Add Tooltip
            var tooltipObject = new StackPanel();

            var title = new TextBlock();
            title.FontWeight = FontWeights.Bold;
            title.Text = con.name;
            tooltipObject.Children.Add(title);
            
            var description = new TextBlock();
            if (con.mp != null)
                description.Text = con.mp.party + " - " + con.mp.name + "\n\n" +getExpenseReport(con.expense); // .Total_Allowances_Claimed_Inc_Travel ; // "Info goes here....."; // "This is an arbitrary description of the \"Huge Square\" to be displayed within the Tooltip.";
            tooltipObject.Children.Add(description);

            image.Tag = con.name;

            ToolTipService.SetToolTip(image, tooltipObject);
            
            //Add the pushpin to the Map 
            myMap.Children.Add(image);

            //Position the pushpin using the attached properties 
            MapLayer.SetMapPosition(image, new Location(con.centre_lat, con.centre_lon));
            MapLayer.SetMapPositionMethod(image, PositionMethod.BottomLeft);

        }

Things I would have liked to do if I had the time:

Better control of the map pins when zooming out, would like some form of clustering and pins to be a bit smaller, 600+ large pins is too much for a place the size of Britain.

Restrict zoom level and panning just to the UK, as things get a bit confusing for the user seeing a small island with los of dots.

Host via Silverlight Streaming, but couldn’t figure out how I could get the deep linking working from an IFRAME hosted on a different domain.

Make the tooltip timeouts longer, but this isn’t a trivial task, though you can find a ToolTipService on codeplex that supports such a feature.

Friday, 27 February 2009

Open Street Map to XAML

After playing around with maps in my previous post, Silverlight USA States Visualisation, I decided to check out the maps at OpenStreetMap and see if I could embed them into a simple Silverlight app, for which you can see a live demo here.

app

Step 1 – Grab the data

This is very easy, just zoom into the location you want and then hit the Export tab, select format PDF and download your PDF image and save the file to disk e.g map.pdf.

streetmap

Once downloaded check all is ok (I had to download twice for some reason as first download was corrupted).

Step 2 – Import to Expression Design

To do this create rename the file to map.ai and import the data (File/Import) into Expression Design. At this stage you may want to delete some of the features, e.g. cost lines, borders etc.

For more info on this step check of post by Tim Heuer.

Step 3 – Export to Silverlight XAML

Select the File/Export and select Silverlight option this will then give you a map.xaml.

In my XAML I noticed 4 <image> of the format shown below, which I striped out of the XAML.

<

Image Source="Ipswich - Open Street Map_files/image3.png"/>

Step 4 – Embed in your Silverlight project

I pasted the contents into  and paste contents of map.xaml into your canvas..

code1

In the app I just add a scale factor based on the mouse wheel ( using Pete Blois MouseWheelHelper class), which works ok but doesn’t update the horizontal / vertical bar sizes/ranges.

code2 See online version here.

A note on file Sizes

The PDF I used for a medium sized English town (Ipswich) resulted in a 700K PDF file. Once converted to XAML this grew to 5.9MB (and still 1.7MB zipped). Trying to edit such a large file in VS2008 proved very slow which each edit of the file taking 10 seconds, hope VS2010 is faster.

Deep earth

For most Silverlight mapping tasks you would probably be better off using something like DeepEarth which makes use of DeepZoom, and a custom map source provider to enable Open Street Map data to be displayed within a Silverlight app, though not sure of the terms and conditions of using OpenStreetMap tile server, but you can see a live demo at http://deepzoom.soulclients.com/osm/.